
Warren County's jobless rate was 4% in September, down from 5.2% in June and below Kentucky's 4.5%. About 3,065 people were looking for work, federal figures show.
Warren County’s unemployment rate was 4% in September. That is down from 5.2% in June, the highest monthly rate of the past year.
The figures come from the U.S. Bureau of Labor Statistics’ county unemployment series for Warren County. The September number is preliminary and can be revised next month.
The September numbers
The bureau’s Local Area Unemployment Statistics for Warren County show:
| September 2026 | June 2026 | September 2025 | |
|---|---|---|---|
| Unemployment rate | 4% | 5.2% | 4.1% |
| People unemployed | 3,065 | 3,923 | 3,082 |
| People employed | 72,658 | 71,013 | 72,397 |
| Labor force | 75,723 | 74,936 | 75,479 |
So from June to September:
- the number of people out of work and looking fell by 858
- the number of people with a job rose by 1,645
Compared with a year earlier, the rate is down a tenth of a point. The county has 261 more people working and 17 fewer unemployed than in September 2025.
How the county compares
These county figures are not seasonally adjusted. The fair comparison is with the state and national rates on the same basis.
- Warren County: 4%
- Kentucky: 4.5%, according to the bureau’s Kentucky series
- United States: 4%, according to the bureau’s national series
Warren County has been below the state rate in every month of the past year. In June, when the county hit 5.2%, Kentucky was at 5.6%.
A year of monthly rates
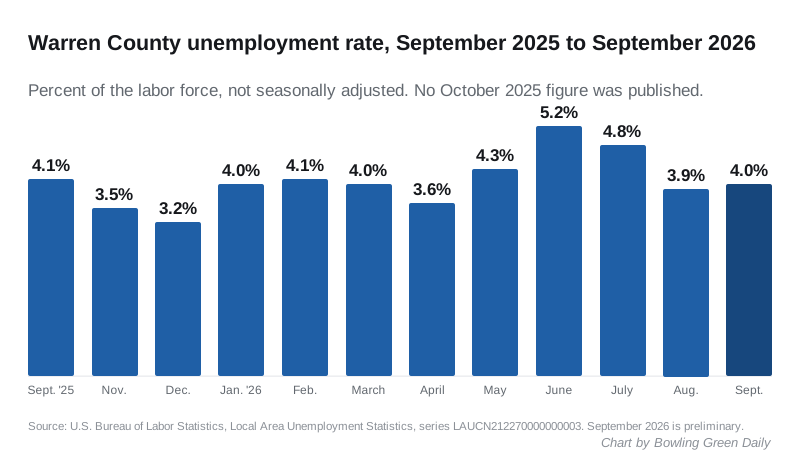
The low point of the year was 3.2% in December 2025. The rate then climbed through the spring, peaked in June and fell back over the summer.
There is no October 2025 figure. The bureau’s series says that month’s data is “unavailable due to the 2025 lapse in appropriations,” the federal government shutdown.
What it means for you
- Job seekers: about 3,065 people in Warren County were looking for work in September, out of a labor force of 75,723. That is roughly one in 25.
- Little has changed over the year. The county’s rate is almost exactly where it was a year ago, and below Kentucky’s.
- Monthly swings are normal in unadjusted figures. A single month up or down is less telling than the same month a year apart.
- The September figure is preliminary. The bureau can revise it when it publishes October’s numbers.
If you are thinking about a move to the area, our guides to home prices in Bowling Green and moving here cover the cost side.
Have your say